Our Approach
ClimaTales is an interactive storytelling tool that introduces an immersive experience where users can explore climate data in various ways. It combines data physicalization & data narratives with the intent of helping teach people with various backgrounds about historical and projected climate patterns specific to the Hawaiian islands.
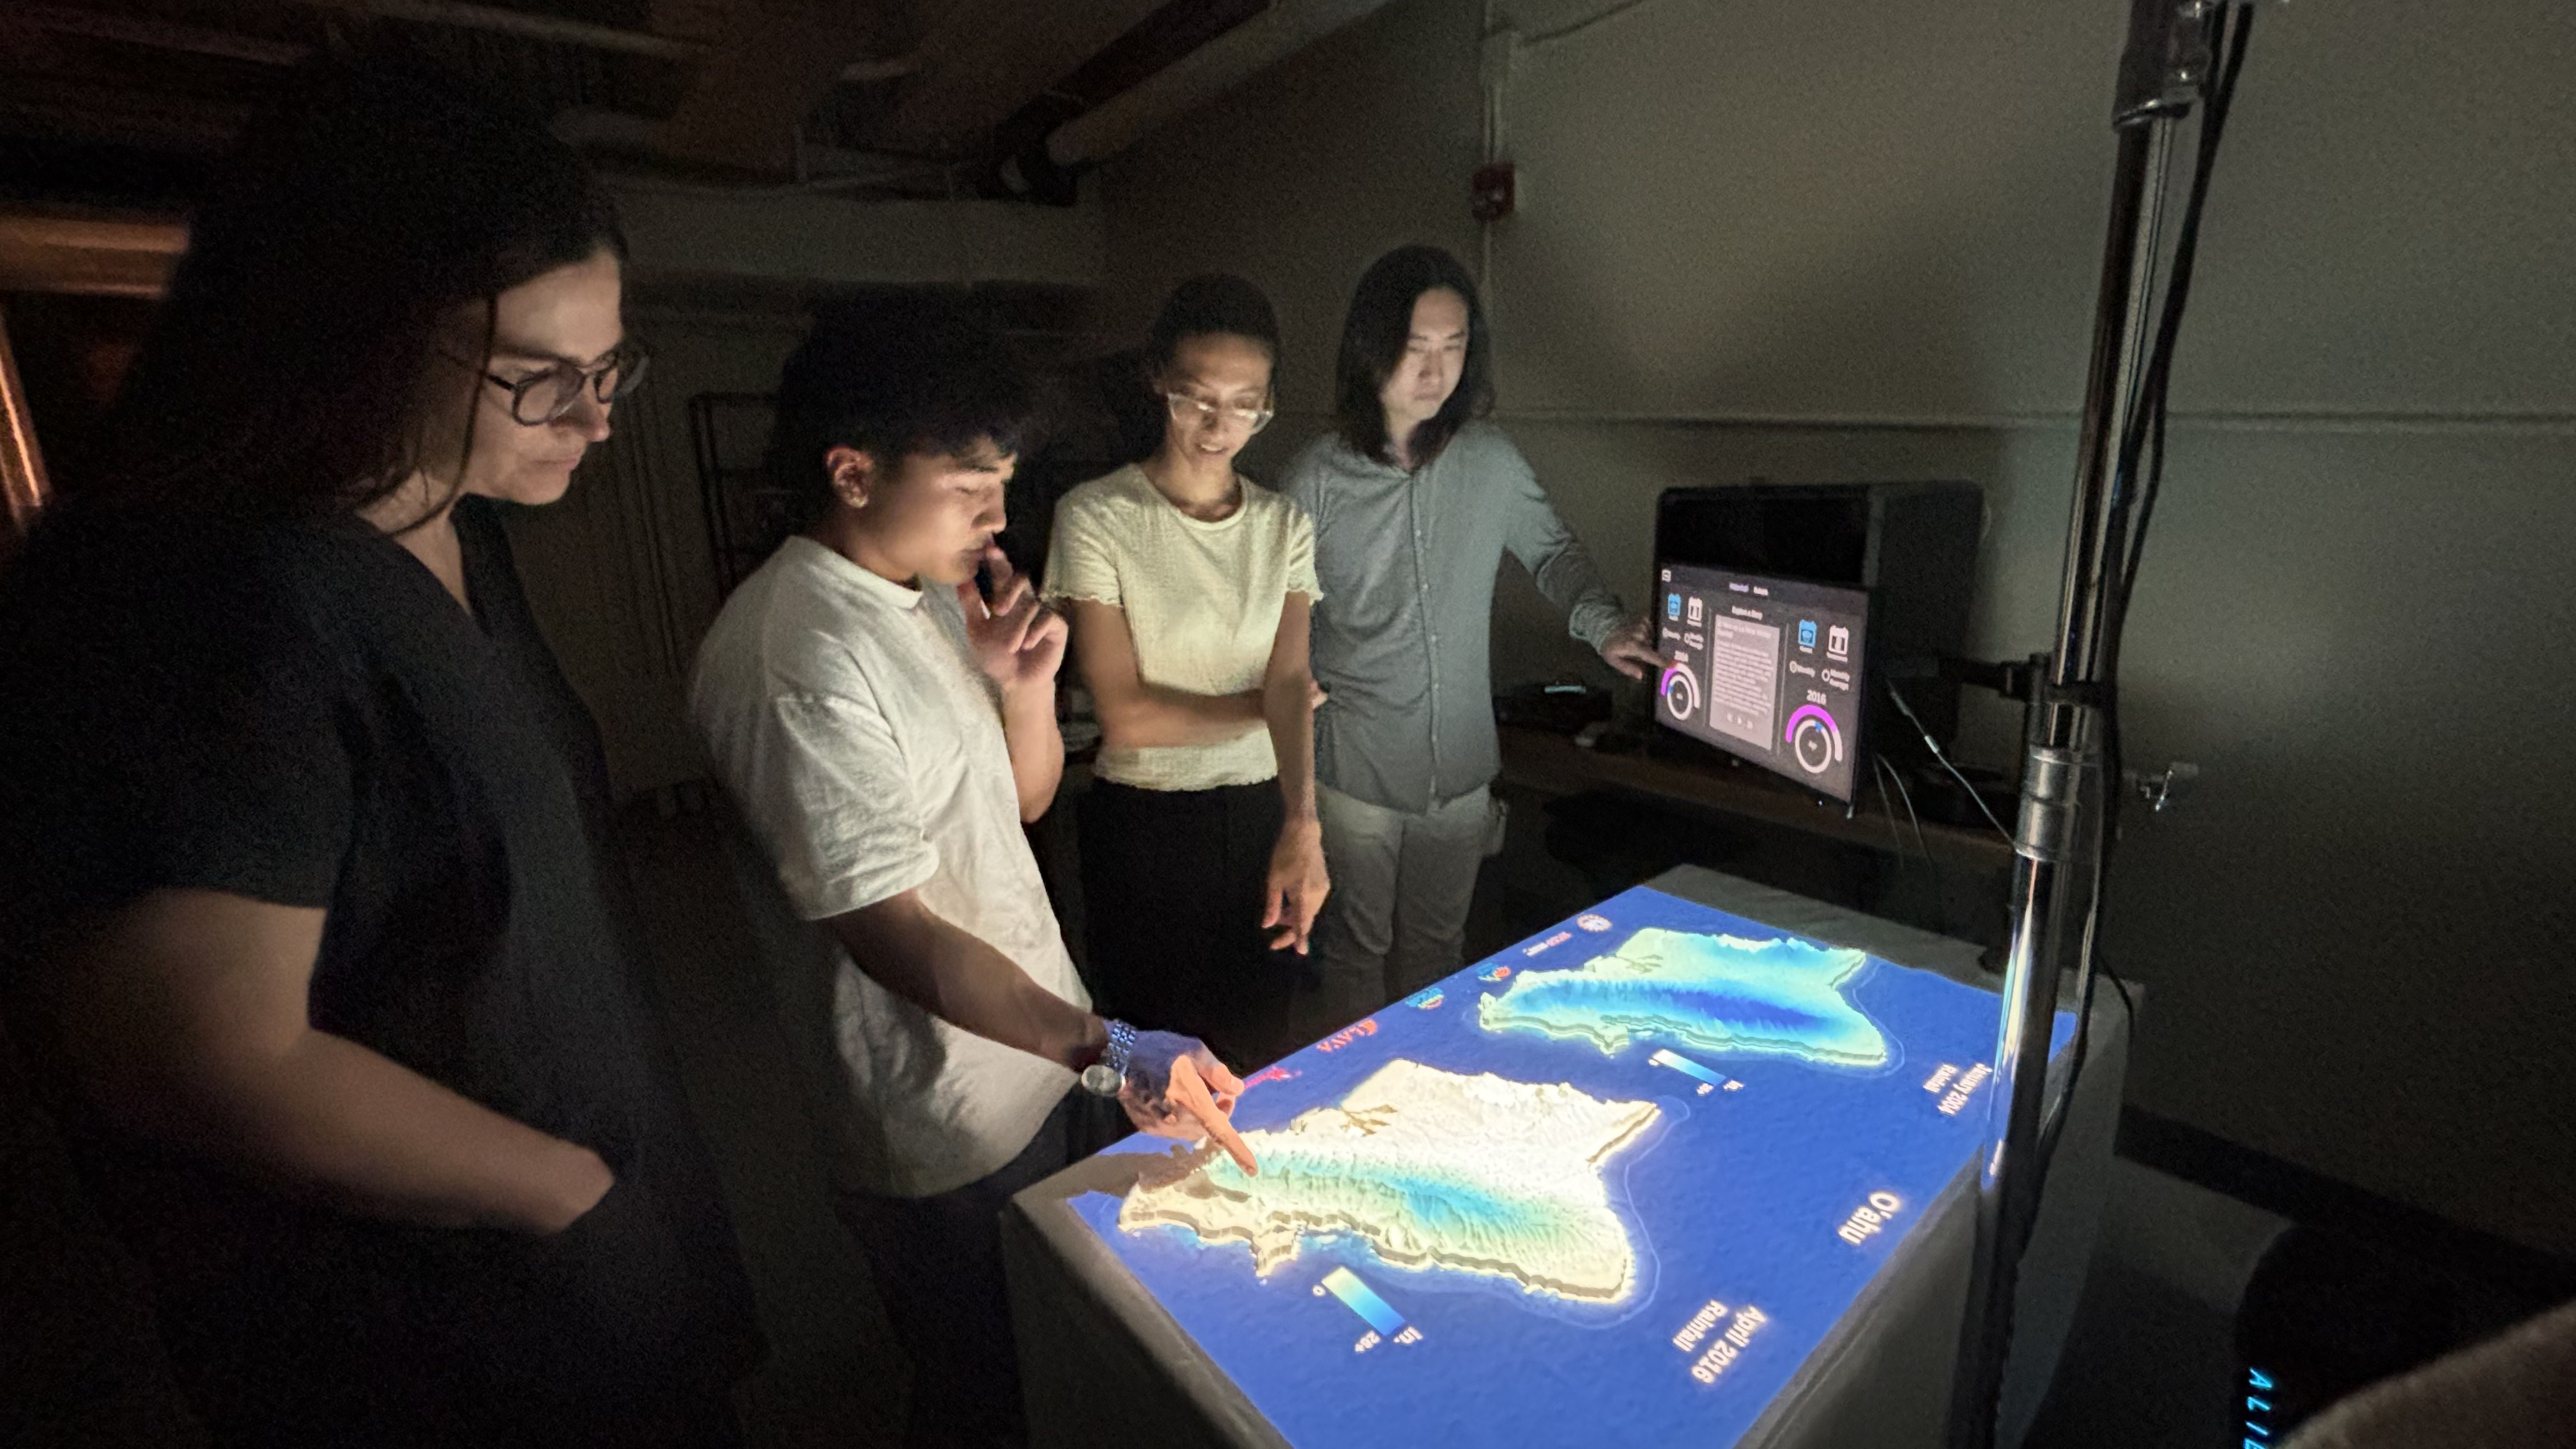
Interactive mode
In Interactive mode, users can explore the historical and future prediction data at their own pace, drawing conclusions through comparing and contrasting different climate variable and temporal data combinations.
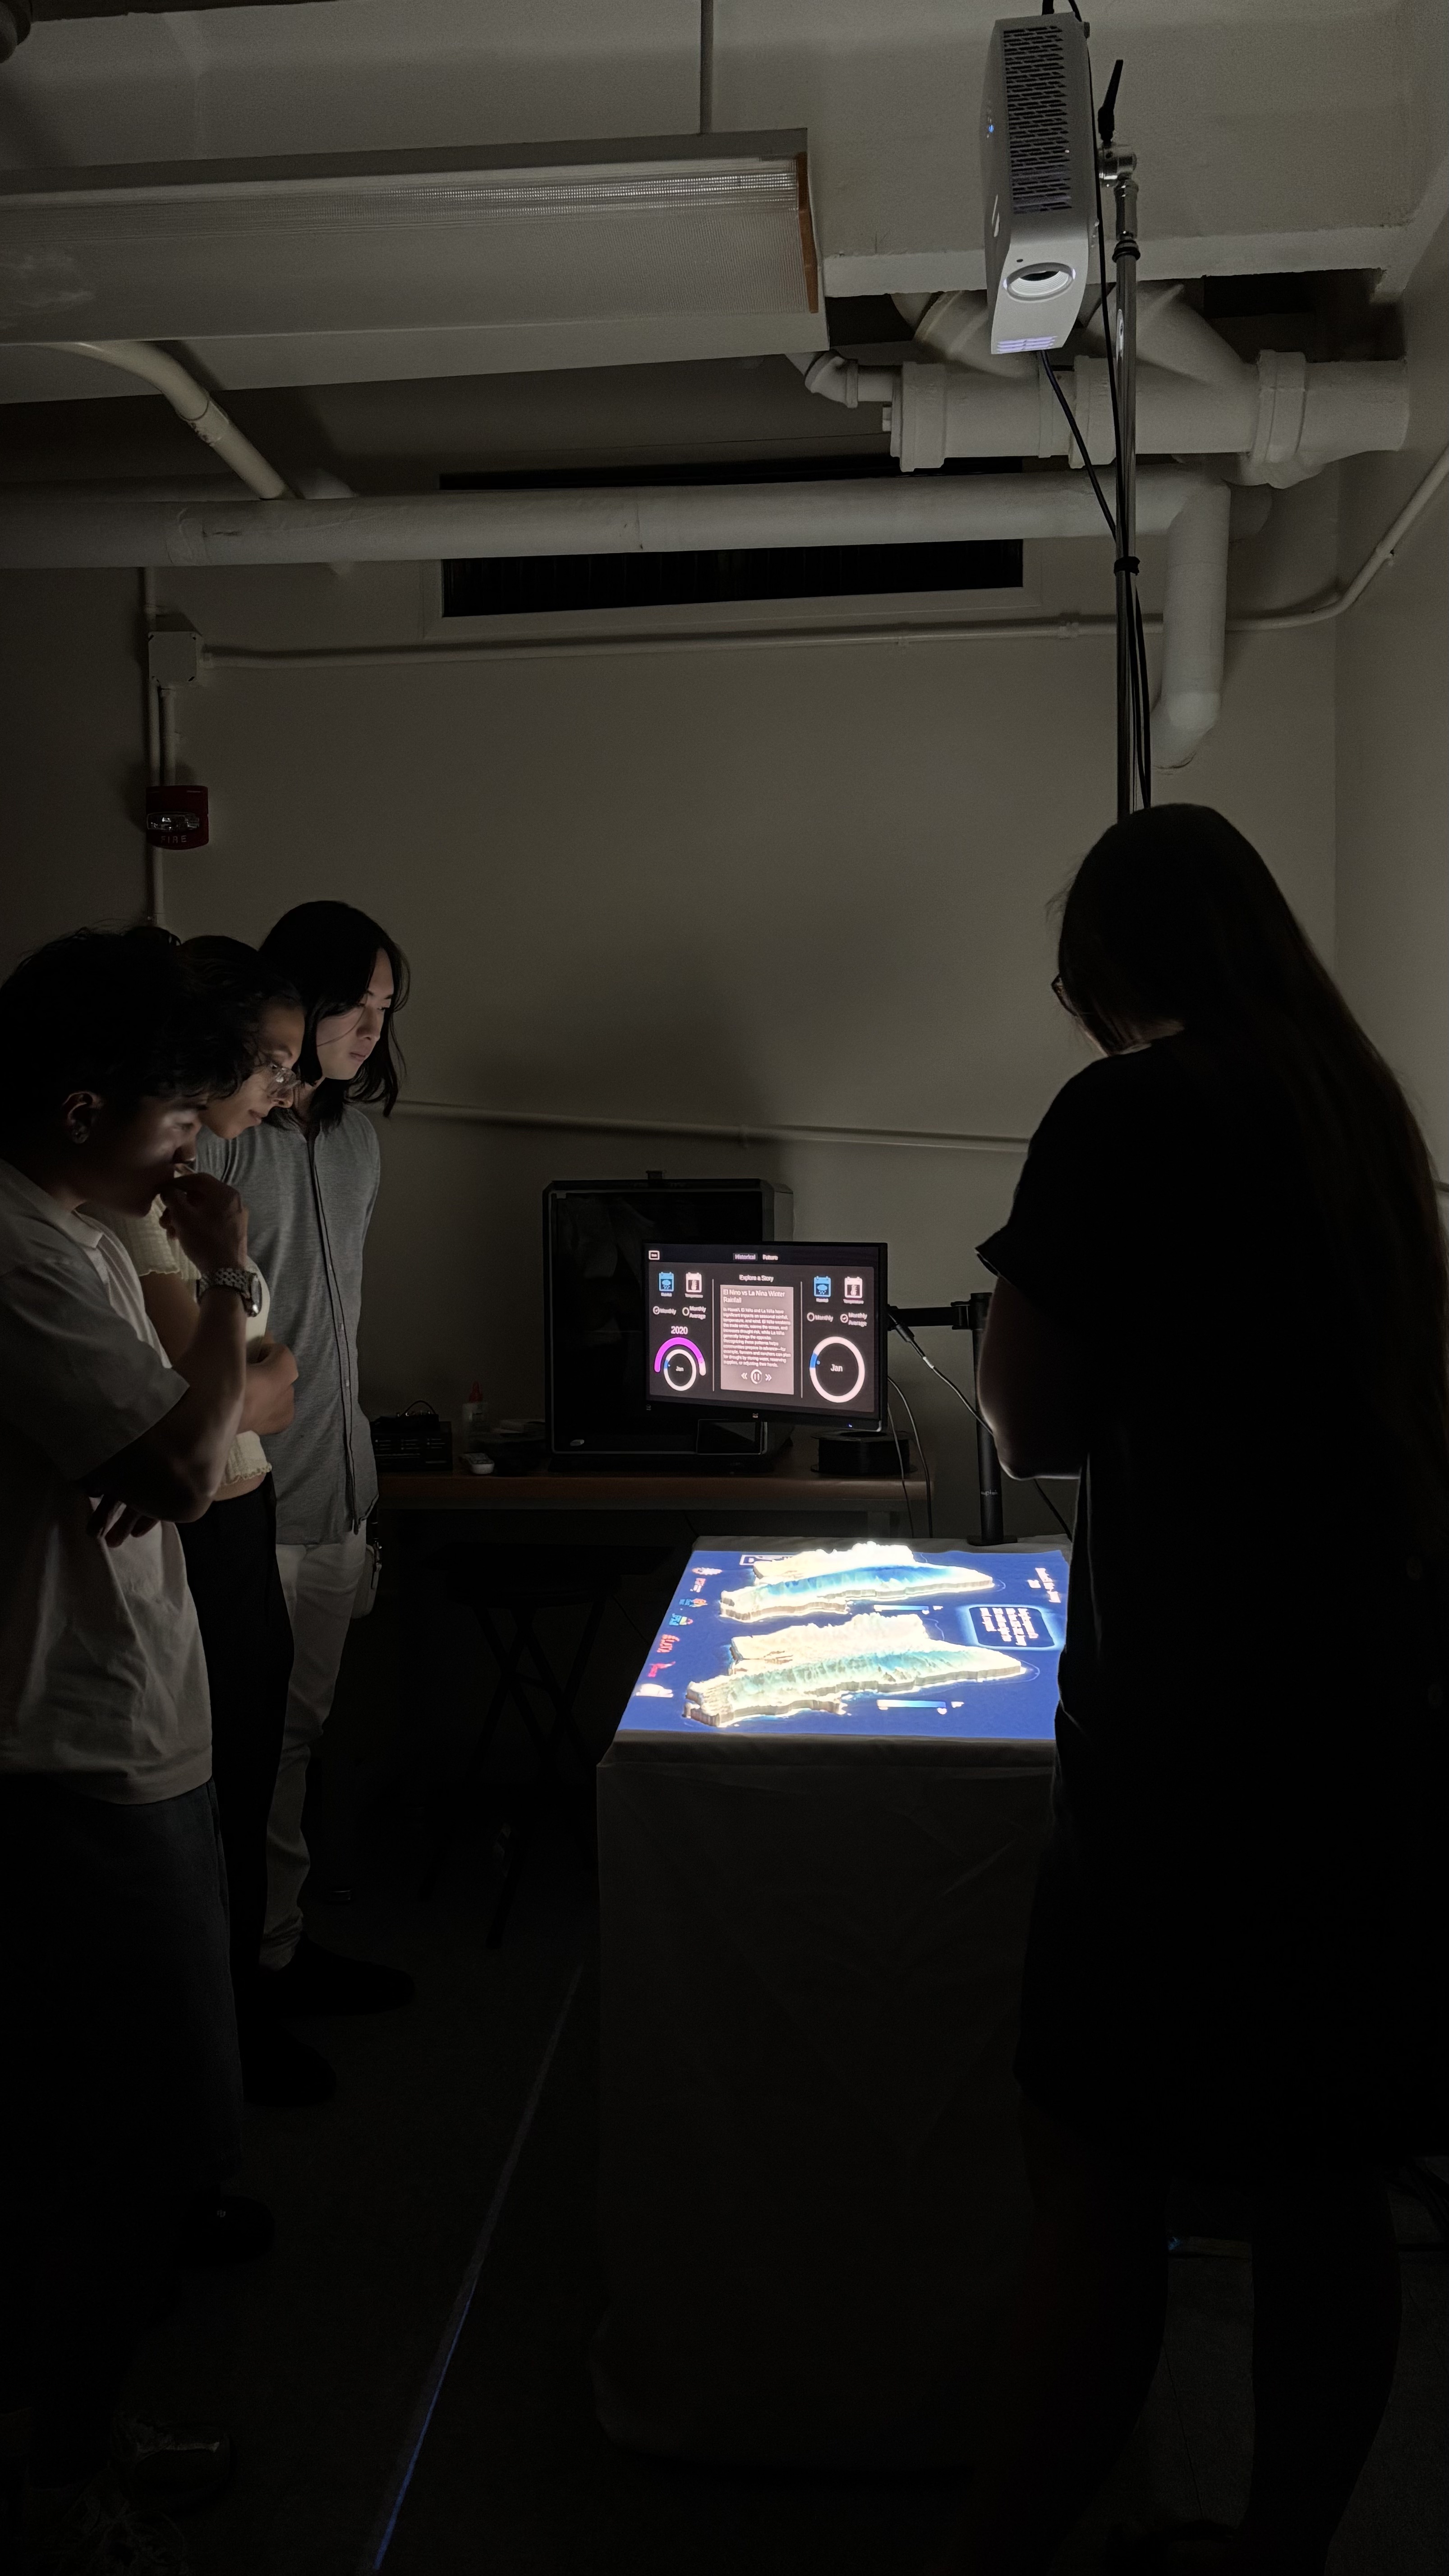
Storytelling mode
In Storytelling mode, users can learn about specific climate patterns that domain scientists want to highlight by watching a sequence of maps and listening to the narration.
System Components
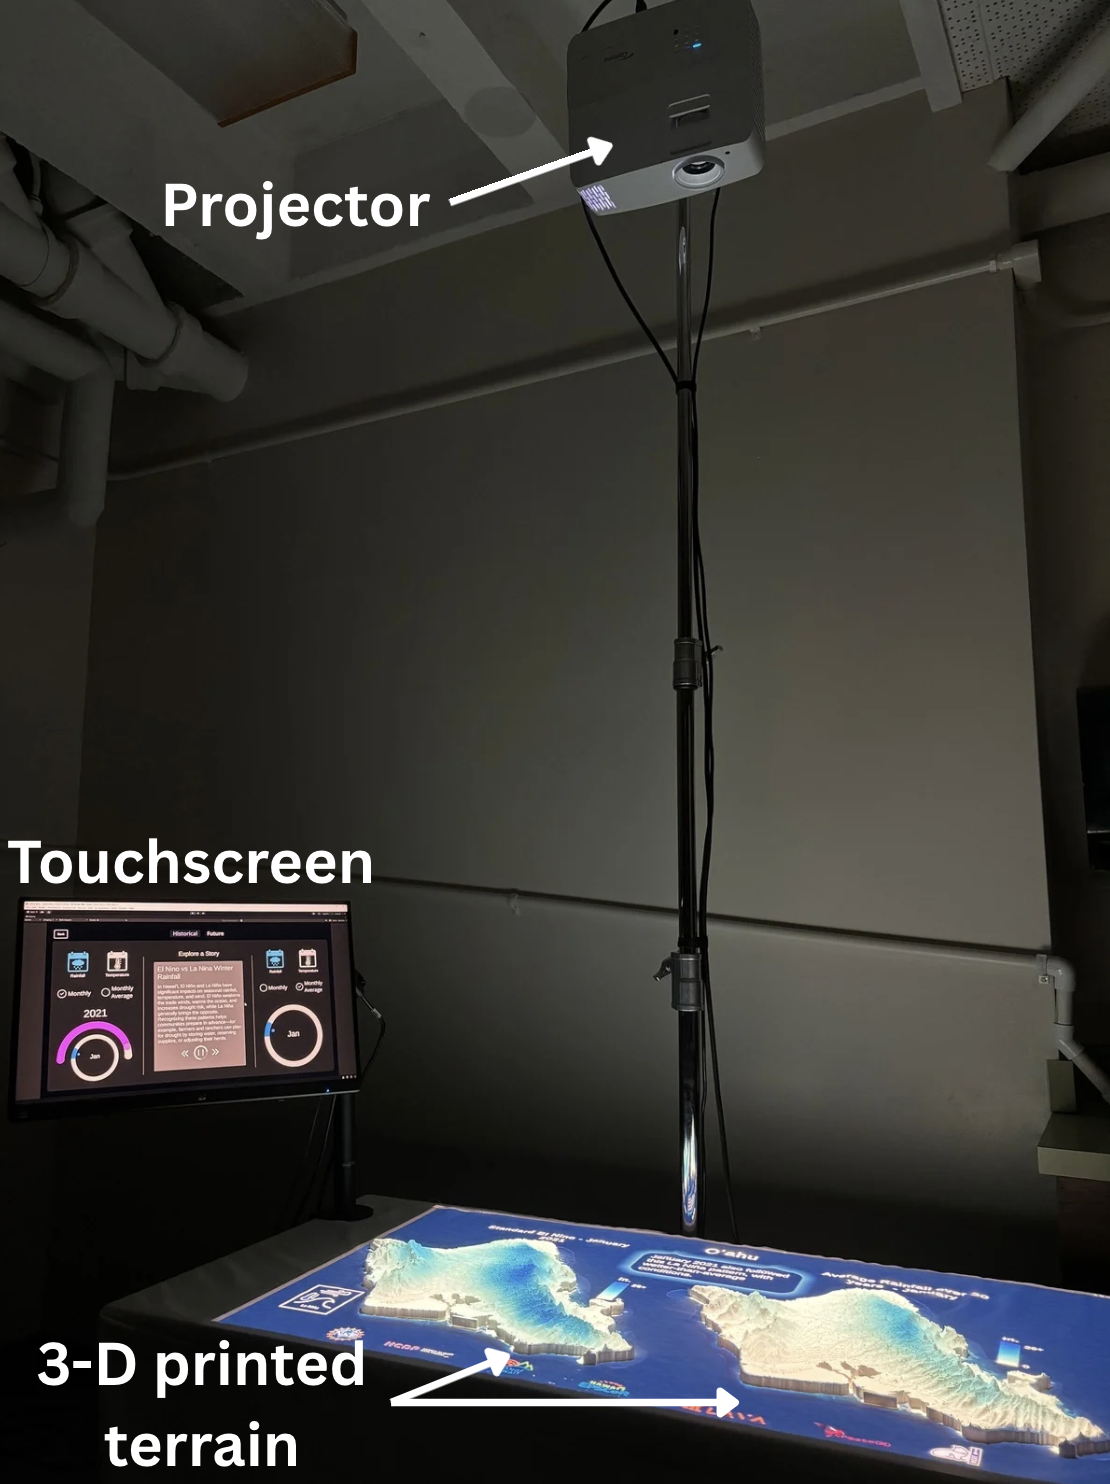
ClimaTales utilizes both data physicalization and spatial augmented reality (SAR) to create an immersive data viewing experience. It builds off of prior research, the ProjecTable and the Makawalu Dev Space tool. The key components of the system are a projector, a touchscreen display, two 3-D printed terrain models, and a computer that drives the whole system.
The projector projects the map visualizations, labels, color scales, and icons onto the table and two terrain models. Users interact with the touchscreen display to control the projections. The islands are used to encourage tactile interactions and to help users draw connections between place and data.
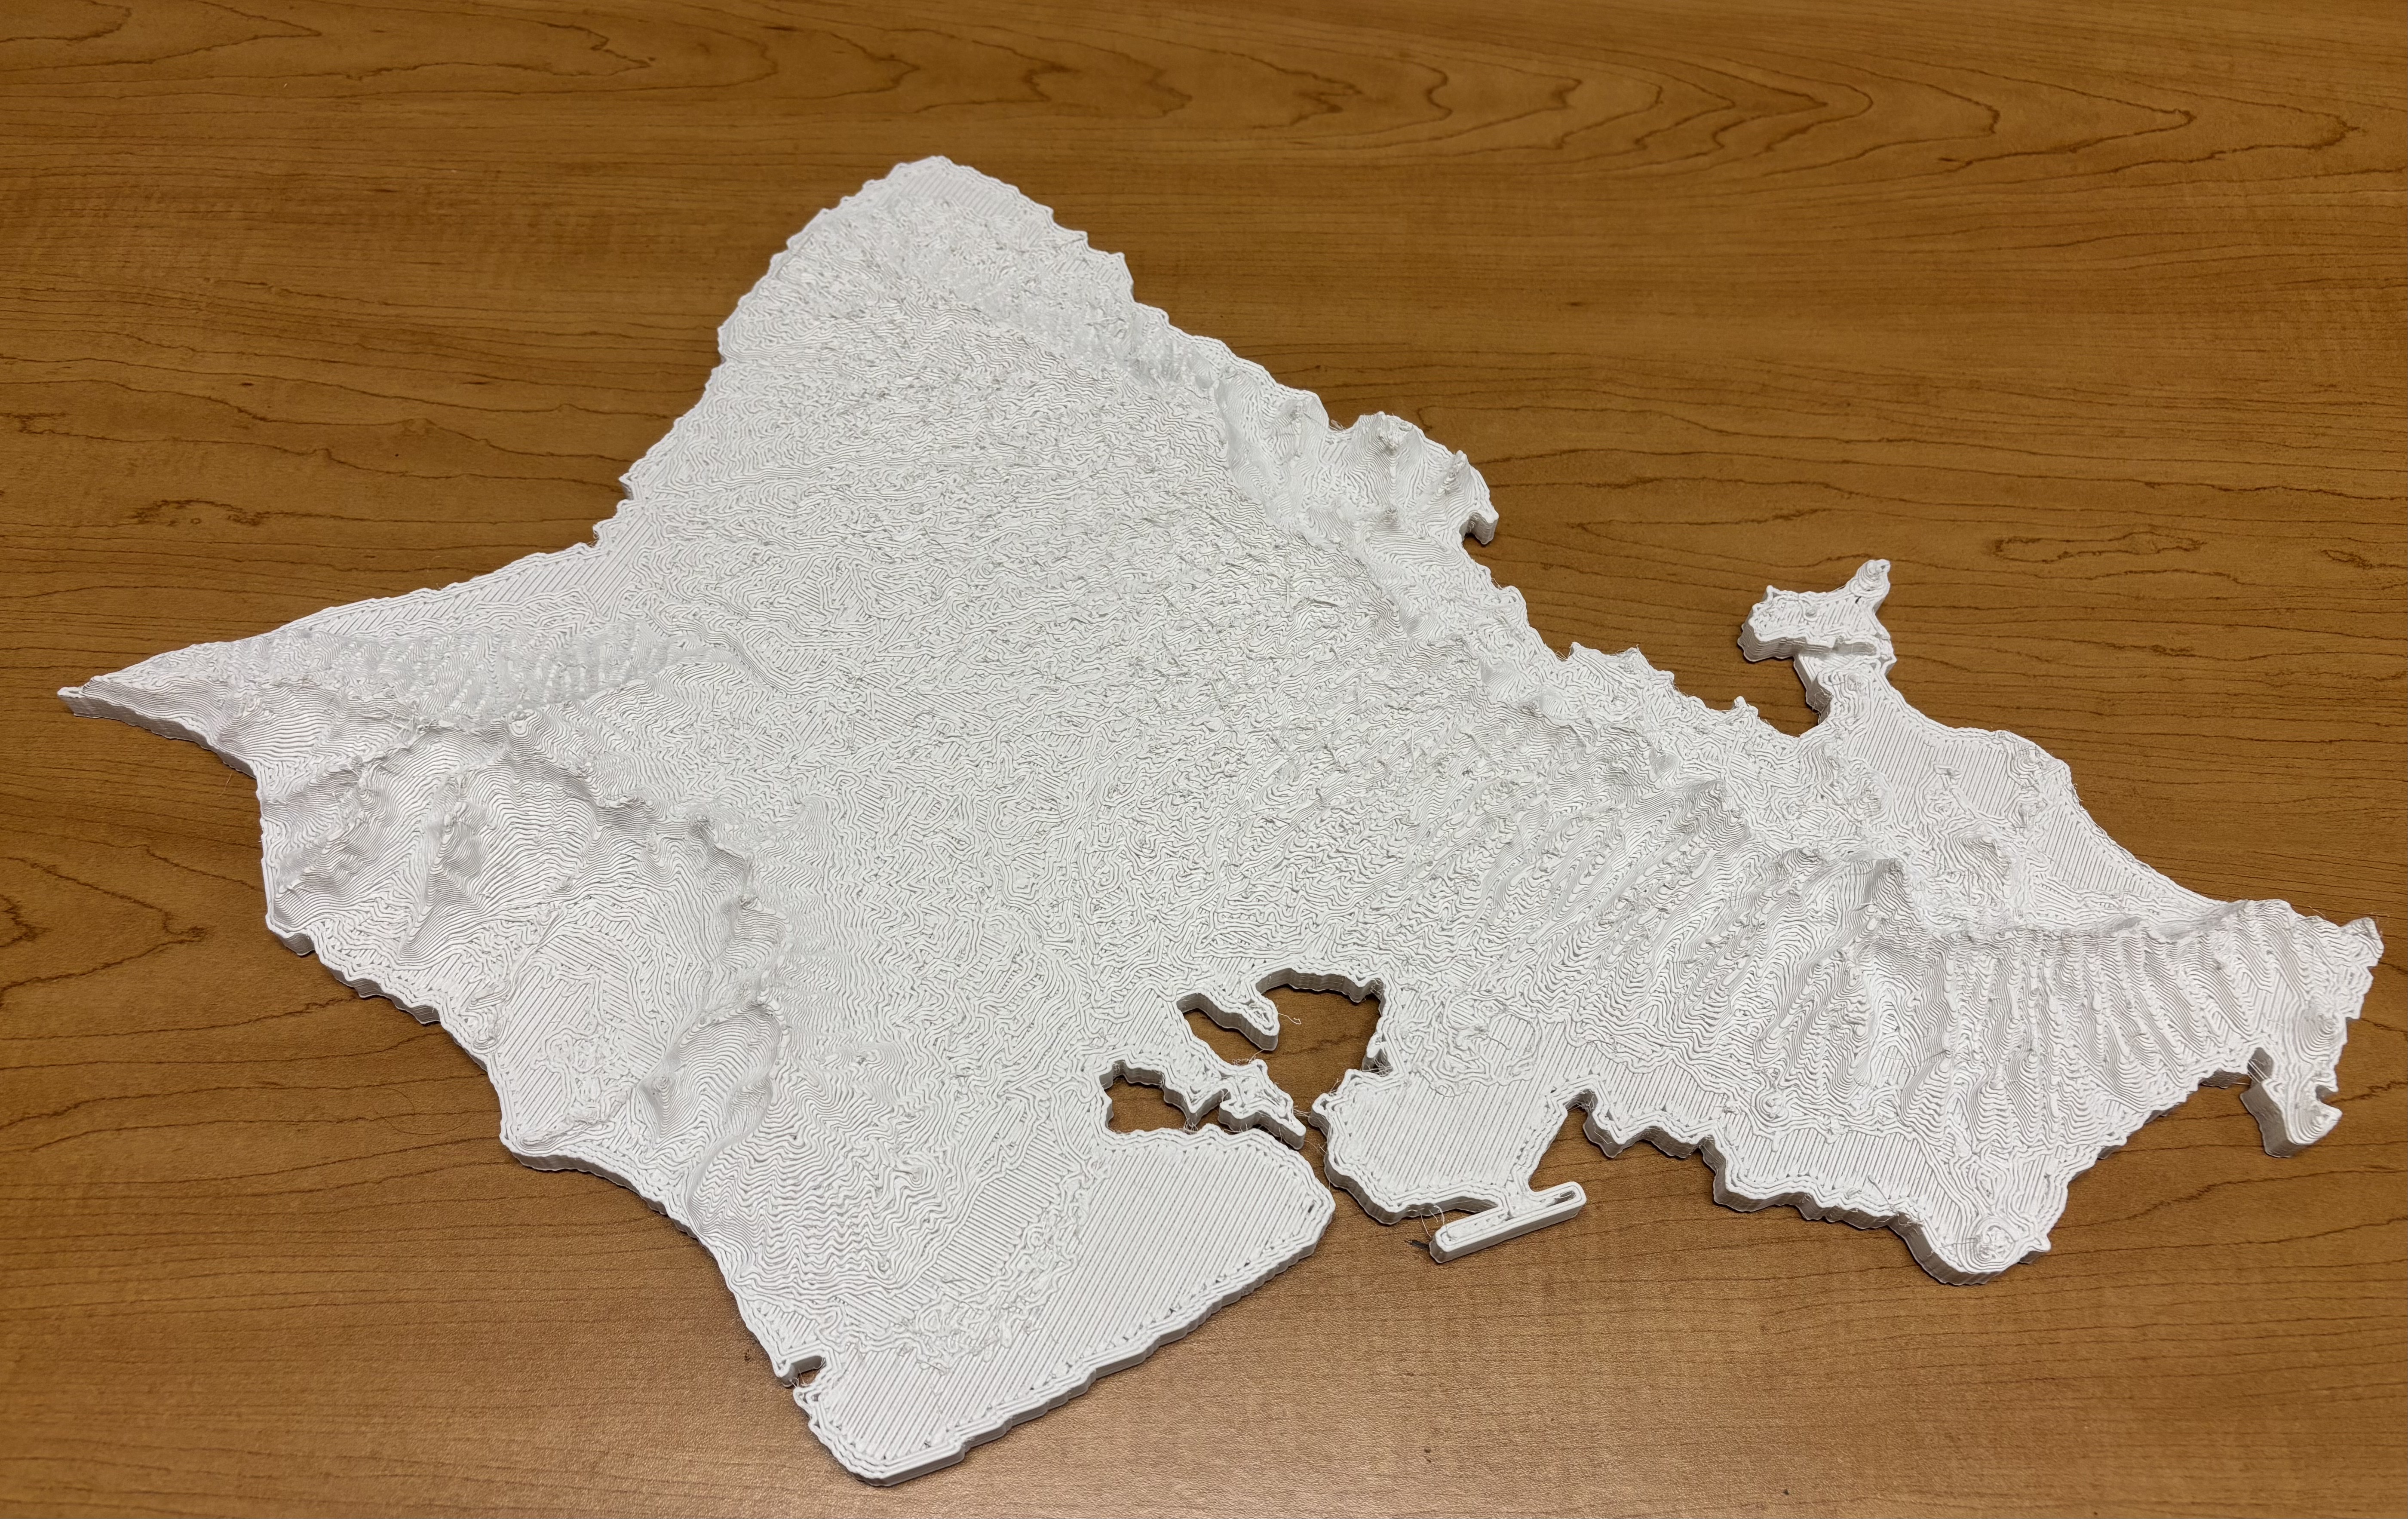
To create the 3D terrain models, we first download a STL file of the island terrain from Terrain2STL. Then, we bring it into Blender to clean up the mesh and add some Z-axis exaggeration. Once we export the file, we generate a gcode file and print the model in a 3D printer. Since the model is printed with PETG, the material sparkles under the light and distorts projection. To fix this, we spray paint the model to get a matte white finish.
Collecting the Data
To gather the dataset used in ClimaTales, we downloaded .tif files directly from The Hawaii Climate Data Portal (HCDP), processed them in QGIS, and import them into the Unity game engine. Once it is all in Unity, the state of the system is managed by scripts that programmatically determine which maps, labels, and scales are projected onto the table
The historical dataset consists of monthly mean rainfall and mean air temperature across Oahu and Maui from 1990 to 2025 as well as the climatological averages of rainfall and temperature across a 30 year period. The future dataset consists of climate prediction data for the same variables and regions across 2 different time periods: the Present (2025) and Late-Century (2070-2099). The data is further categorized by downscaling methods (statistical vs dynamical) used to generate the predictions and scenarios which show different levels of greenhouse gas emissions (RCP 4.5 vs RCP 8.5).
Story Development
Taking inspiration from storyboarding, we developed a script format that enables domain scientists to write their stories and easily import them into ClimaTales. The script format consists of a table where each row corresponds to a "page" that specify the maps, labels, and narration for each step of the story. Once domain scientists fill out the table, it is converted into a JSON file that the ClimaTales system reads and stores into the Storytelling UI story list.
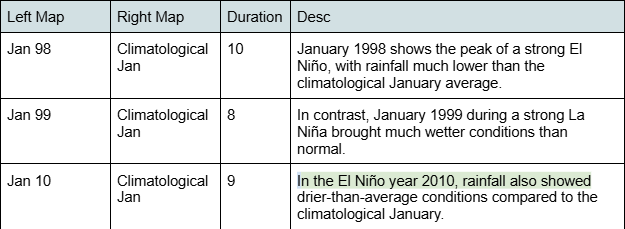
Example of the story script format
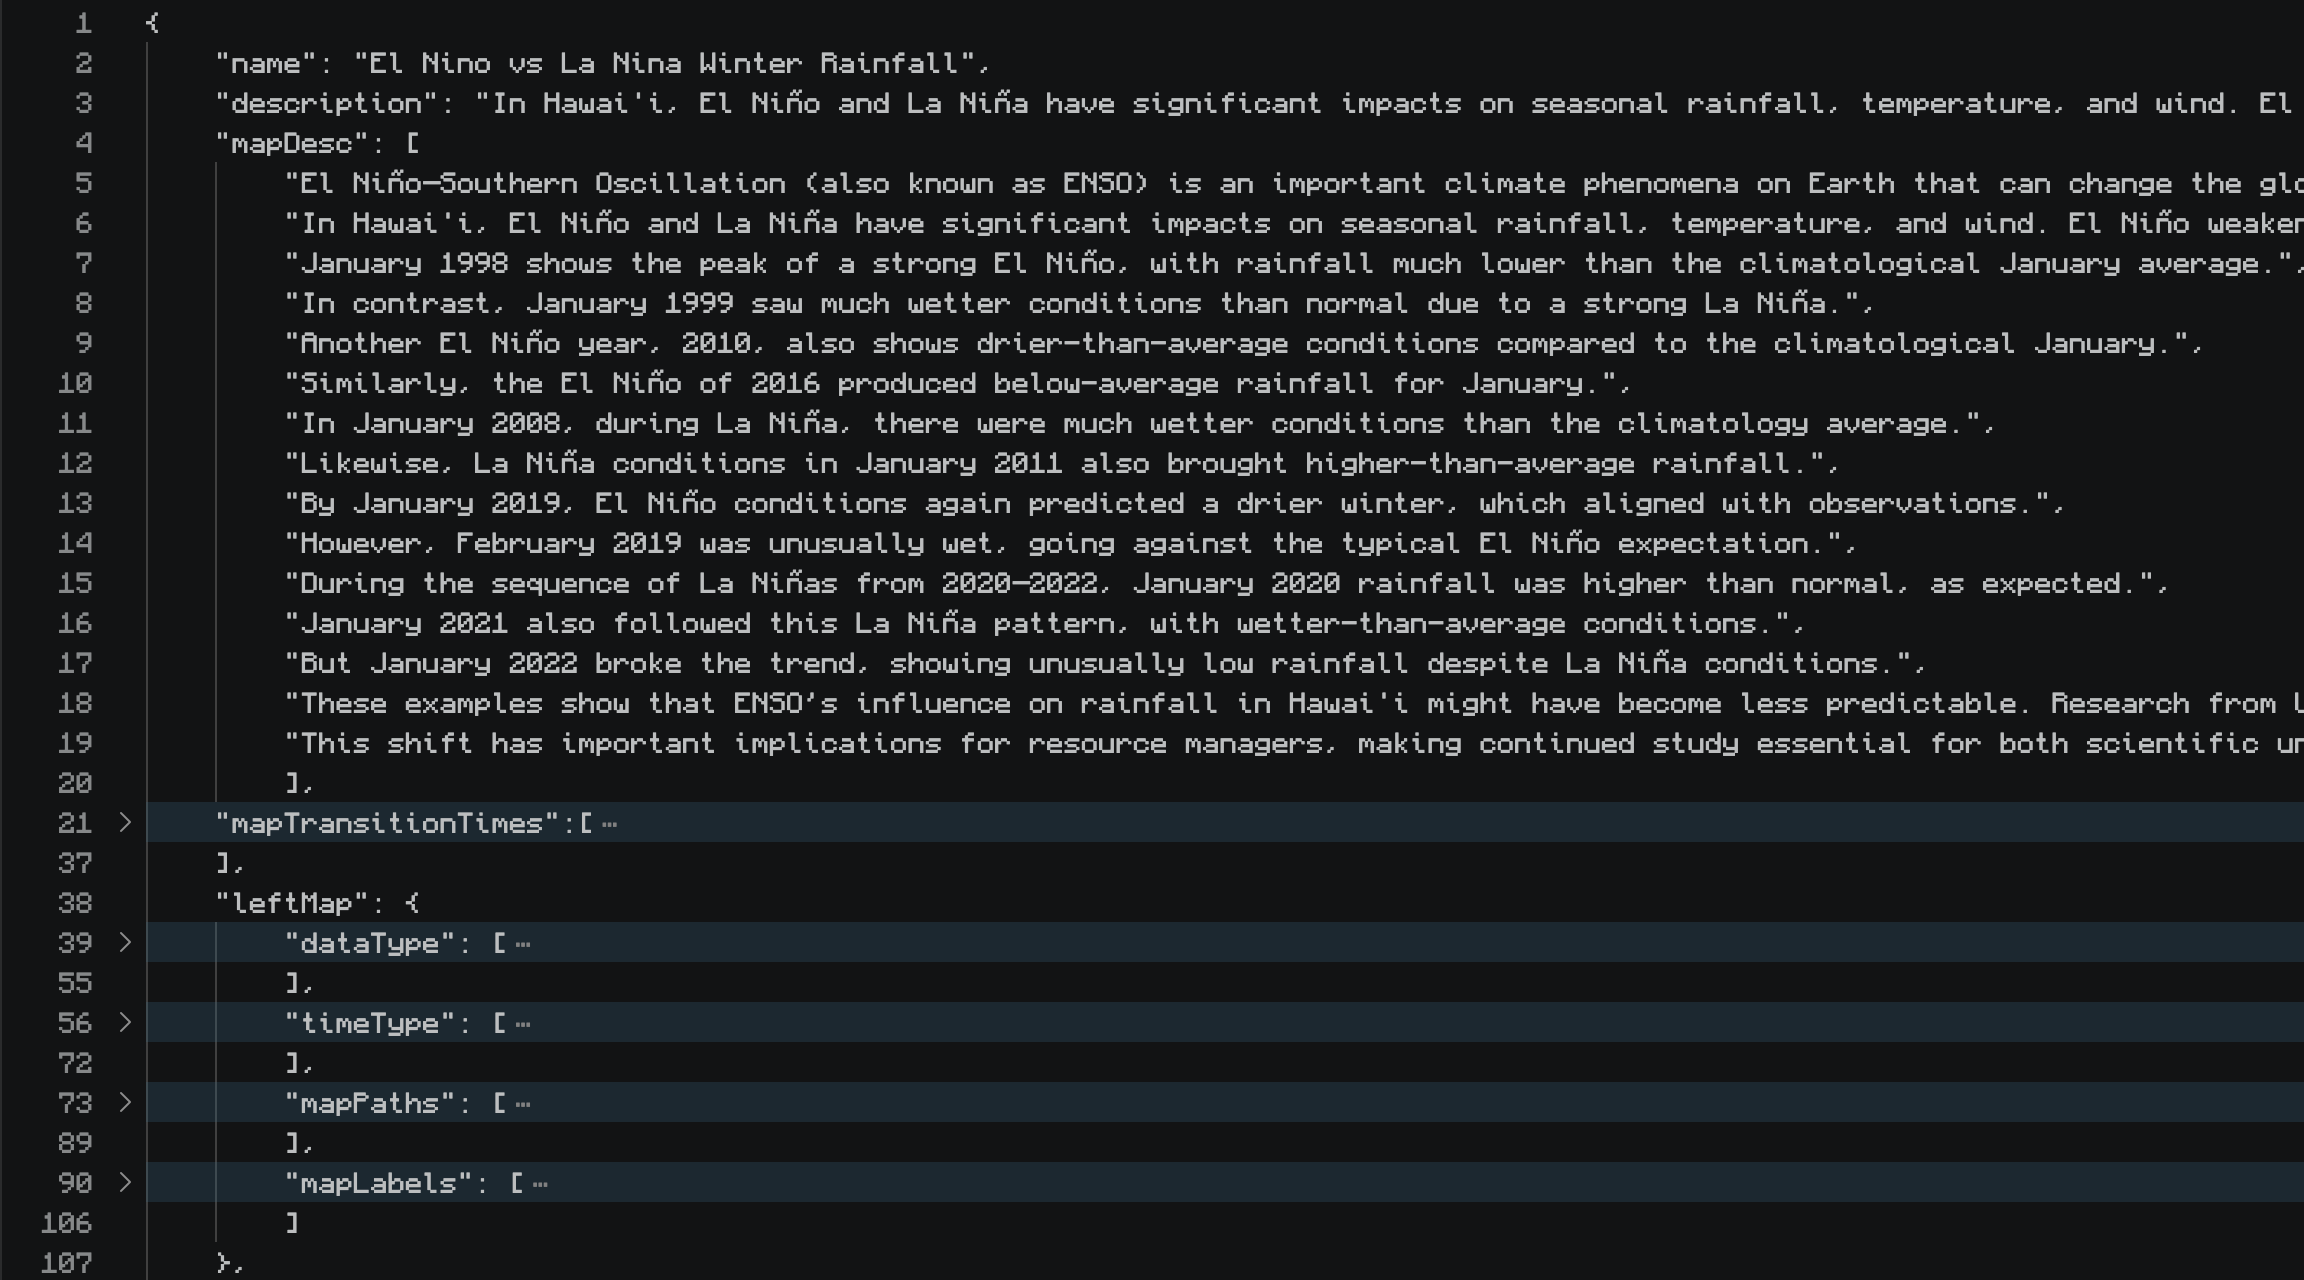
Example of the JSON output
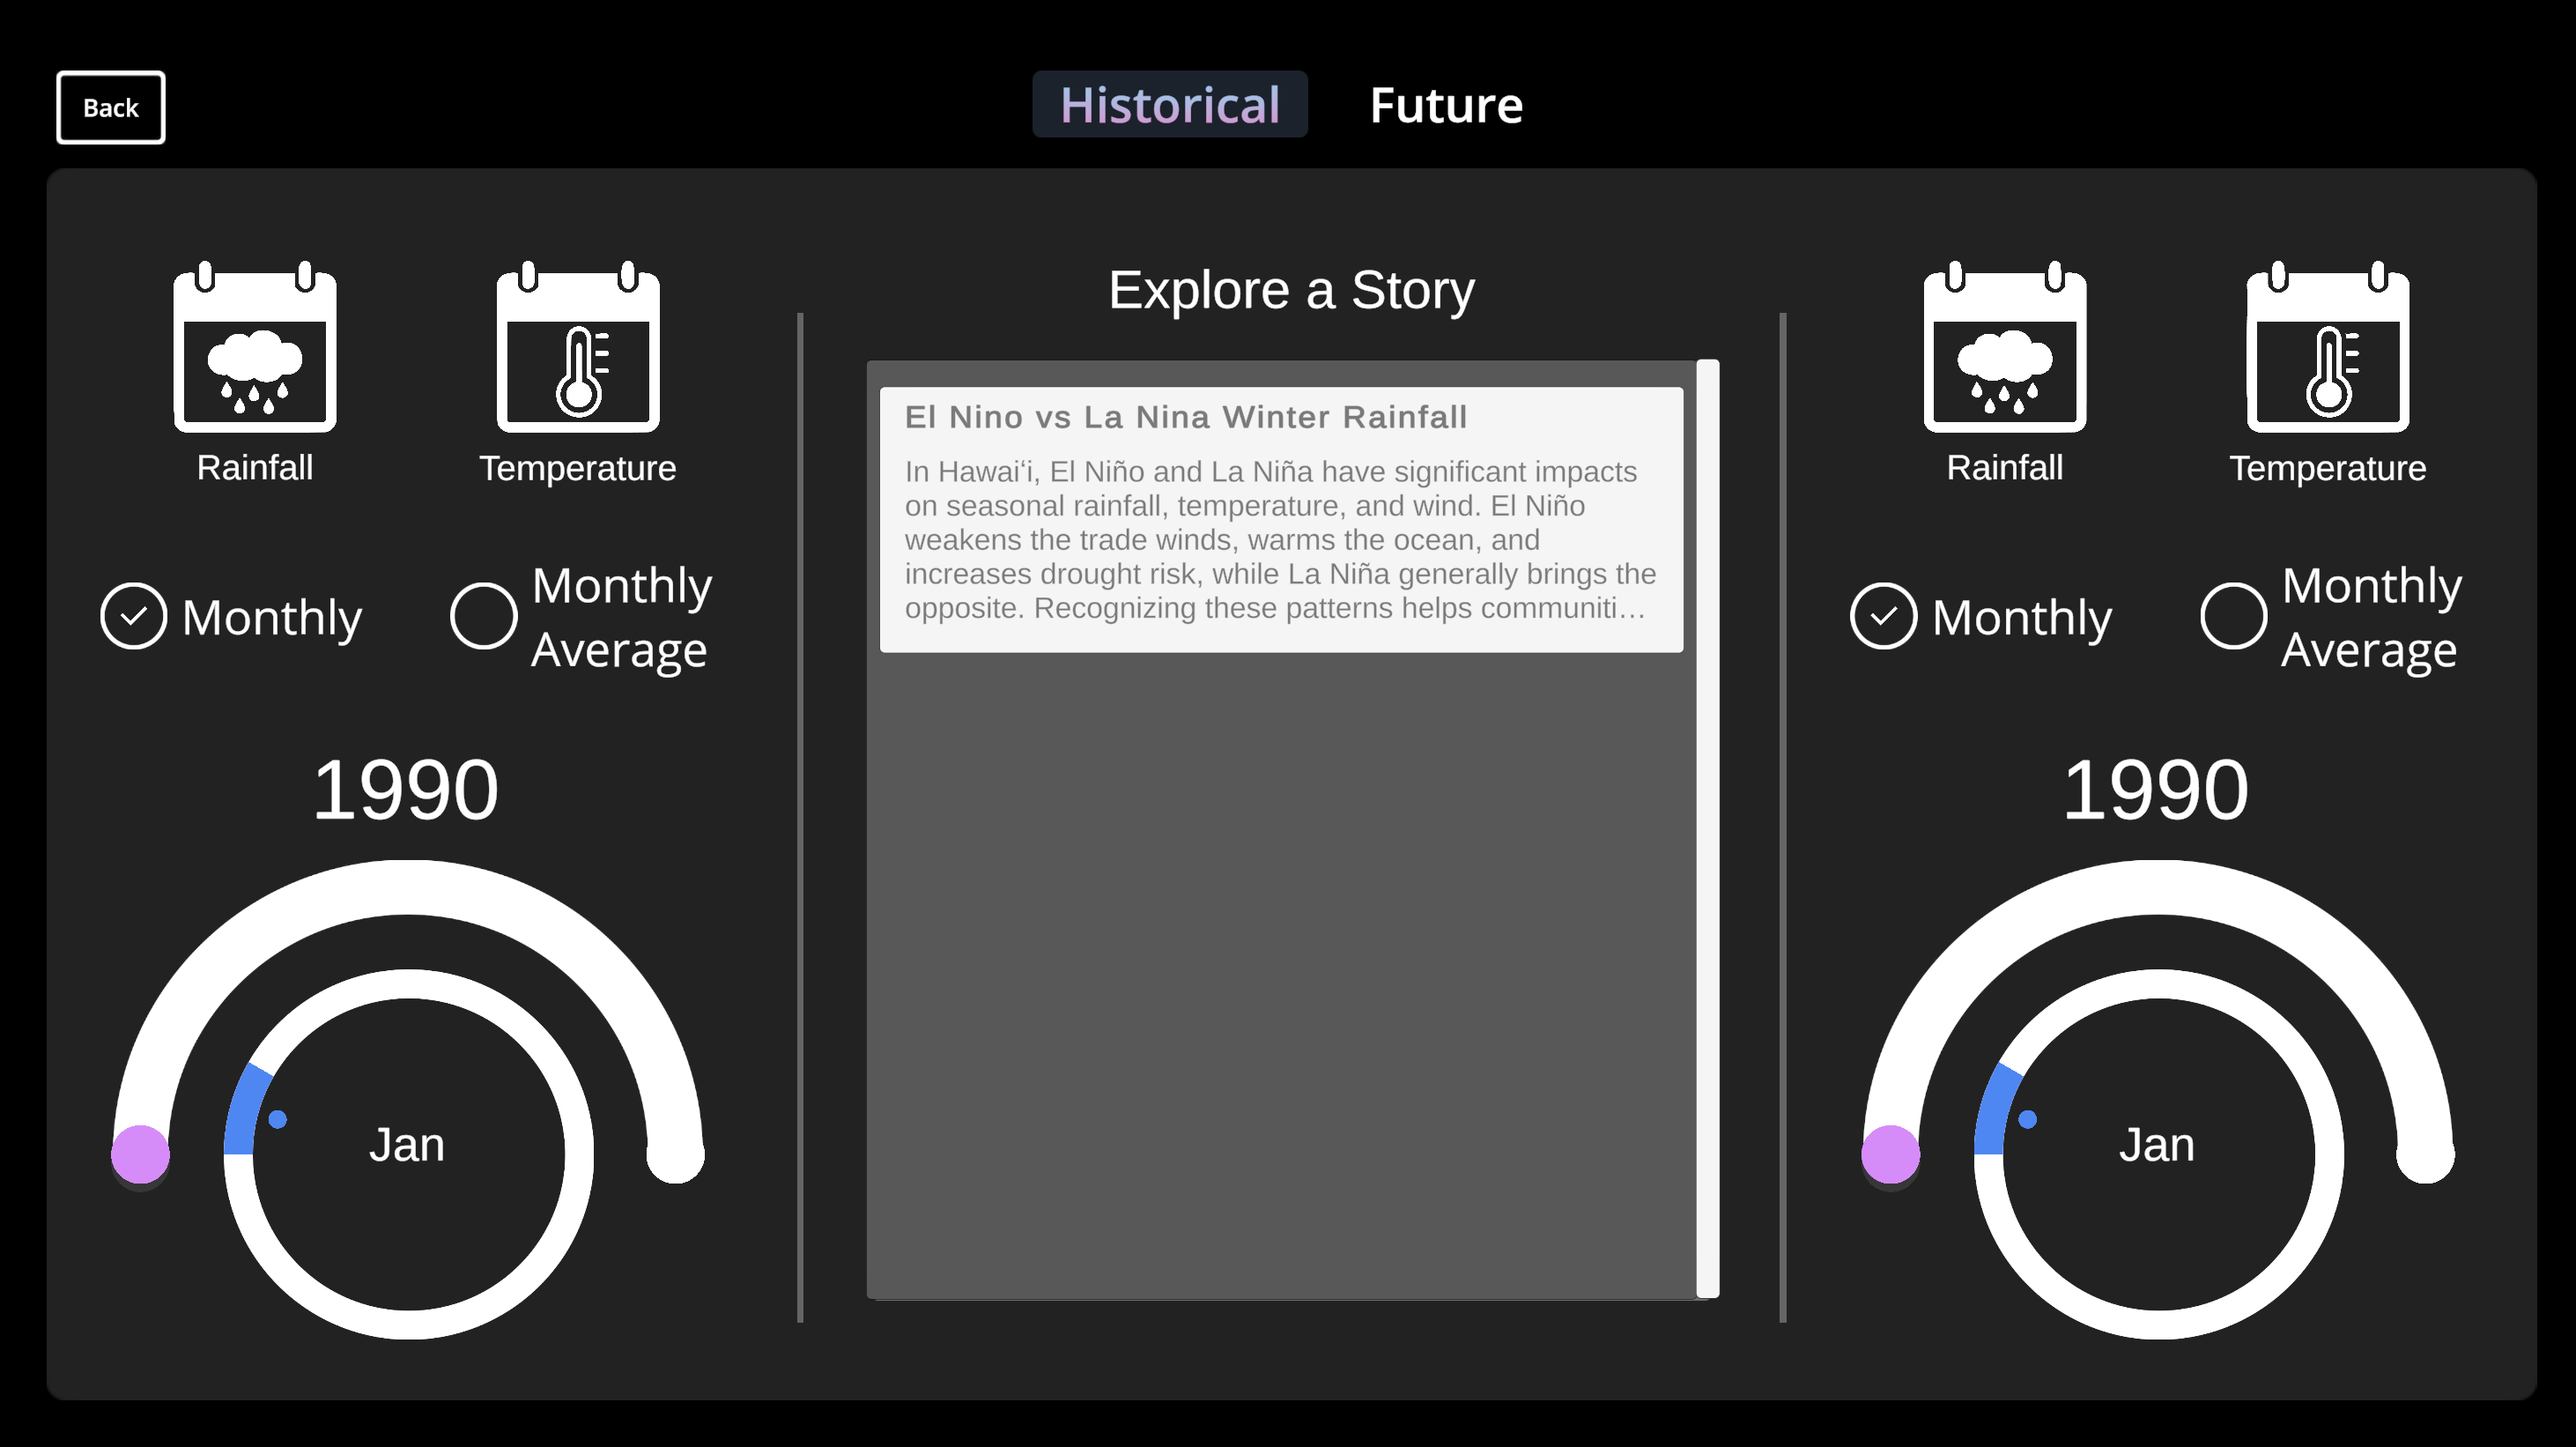
Example of the Storytelling UI story list
What's Next
We want to connect ClimaTales with the HCDP API to reduce processing time and project bloat. This will result in a wider variety of data for users to explore as well as more narratives that domain scientists can author. We'd also like to connect ElevenLabs to ClimaTales to enable dynamic narration generation so that story development becomes more efficient.